Coronary Angiography Report Plugin User Manual
This user manual explains how to use the Coronary Angiography Report Plugin for OsiriX MD.
- Open the study in the 2D Viewer
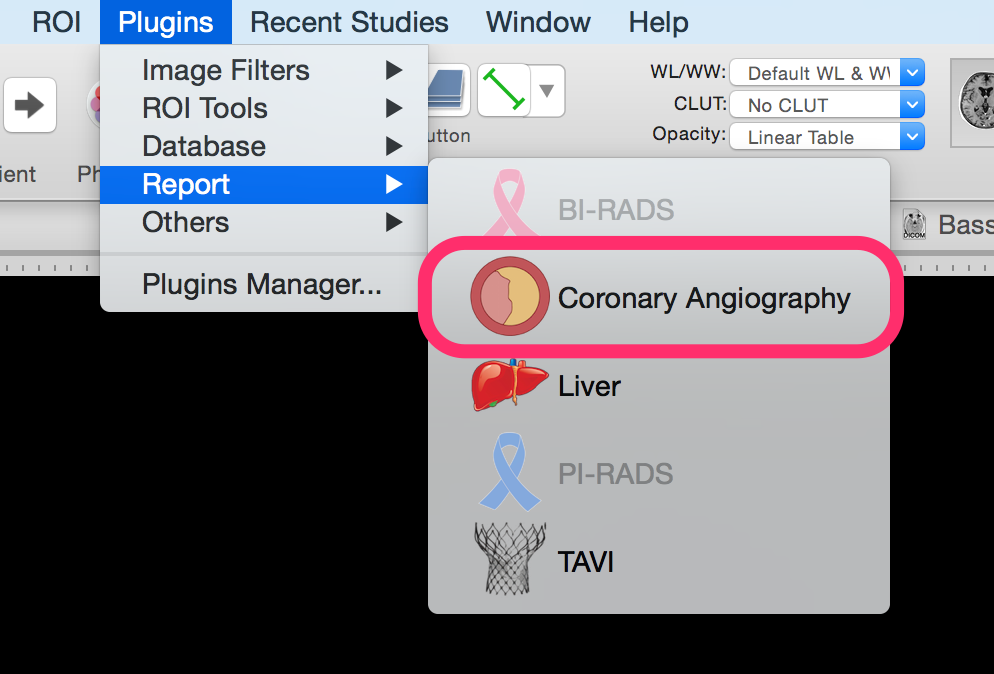
- Launch the plugin, located in the Plugins menu, in the Report submenu.
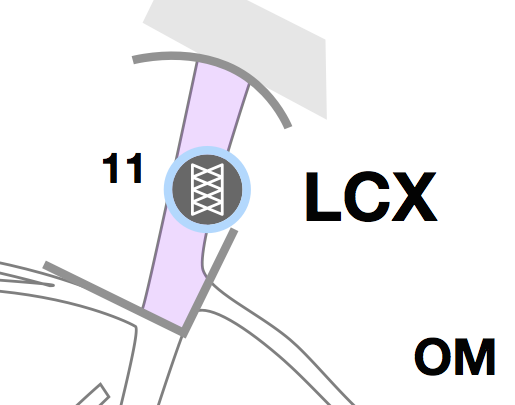
- Add lesion markers to the diagram by choosing a level of stenosis from the set of buttons in the bottom part of the diagram

Stenosis 0%-25% Stenosis 25%-50% Stenosis 50%-75% Stenosis 75%-99% Occlusion Undetermined Stent (Special marker) - Drop the marker on any segment (selected segment will be highlighted)
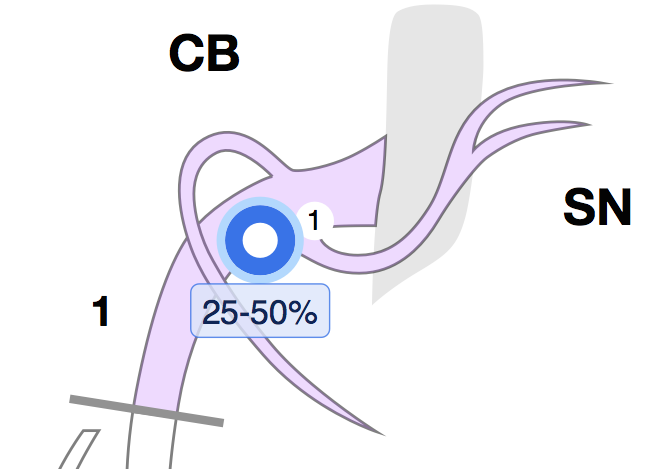
The marker will display the stenosis value (bottom) as well as the lesion index (top right).
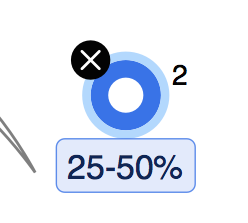
- Click on any lesion on the diagram to select it.
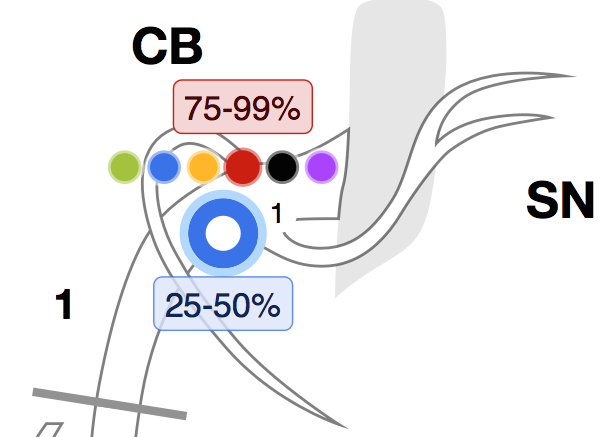
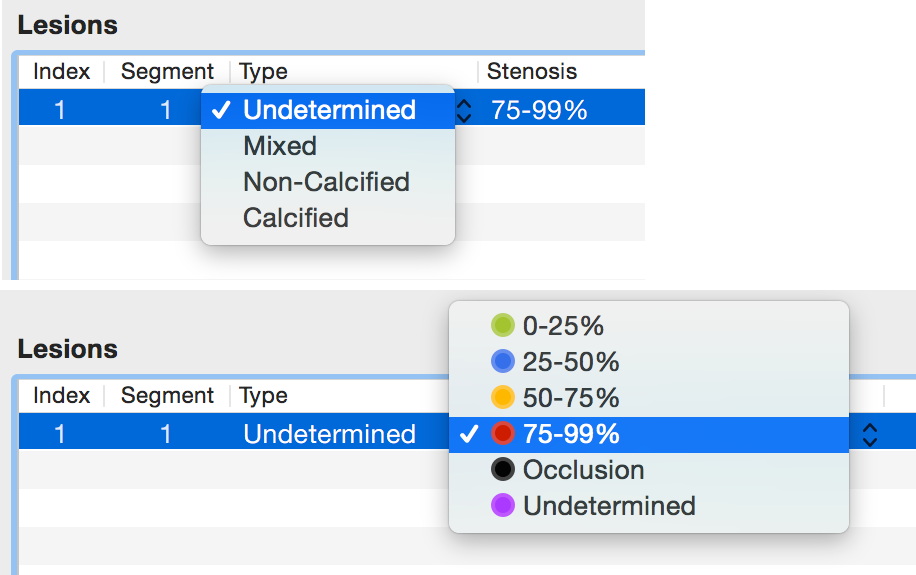
Using the small color buttons on top of the marker, you can quickly change the stenosis value.
From the Lesions table, you can change the stenosis value, the type of lesion and the lesion's length.
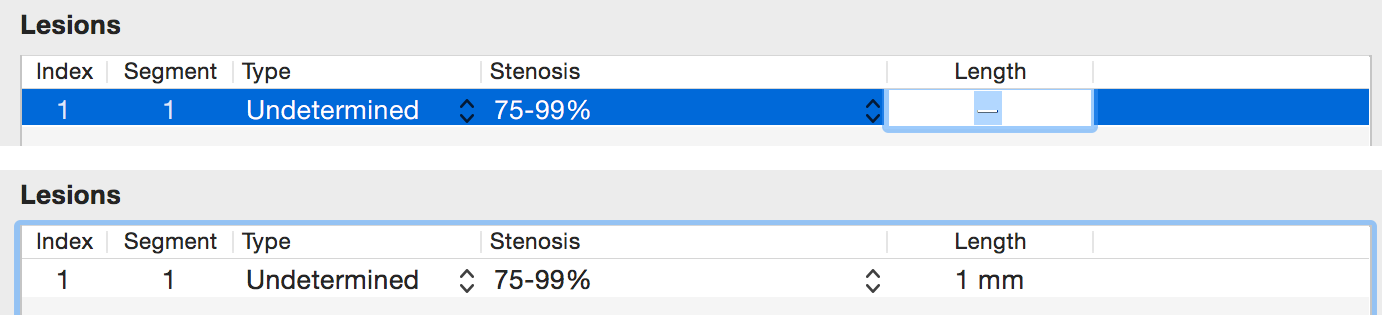
To set a lesion's length double-click on the length parameter in the table and enter the value with your keyboard.
- Special kind of markers can be placed to represent stents
- To remove a marker, drag'n drop it outside of any segment or hit the delete key of the keyboard
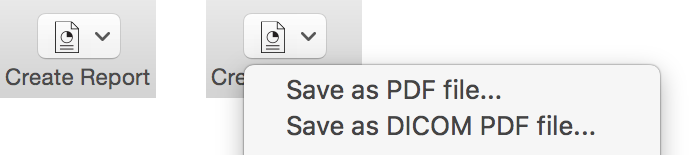
- To generate a report click on the PDF Report (or DICOM PDF Report) button or on the Create Report button
- The resulting report will look like this (click on the image to download the PDF report)