Background
Radiology services are now complex structures with constrained resources. They have to focus on targets for performance, patient quality optimisation, and structural costs. Department managers need exact and live statistics to monitor activities and ensure that costs are constrained and efficiency targets are reached.
OsiriX Statistical Analysis tool
OsiriX Statistical Analysis allows to extract a live statistical analysis on any imaging sources (DICOM nodes or DICOM databases). It is a management tool where you can track indicators, discover areas for optimisation, and monitor the quality of the service provided to the patient. This tool helps to analyse the efficiency of radiology department. This tool is fully customizable, you can easily create your own dashboards to monitor your own parameters.
Use cases
Question: Is our medical equipment fully utilised?
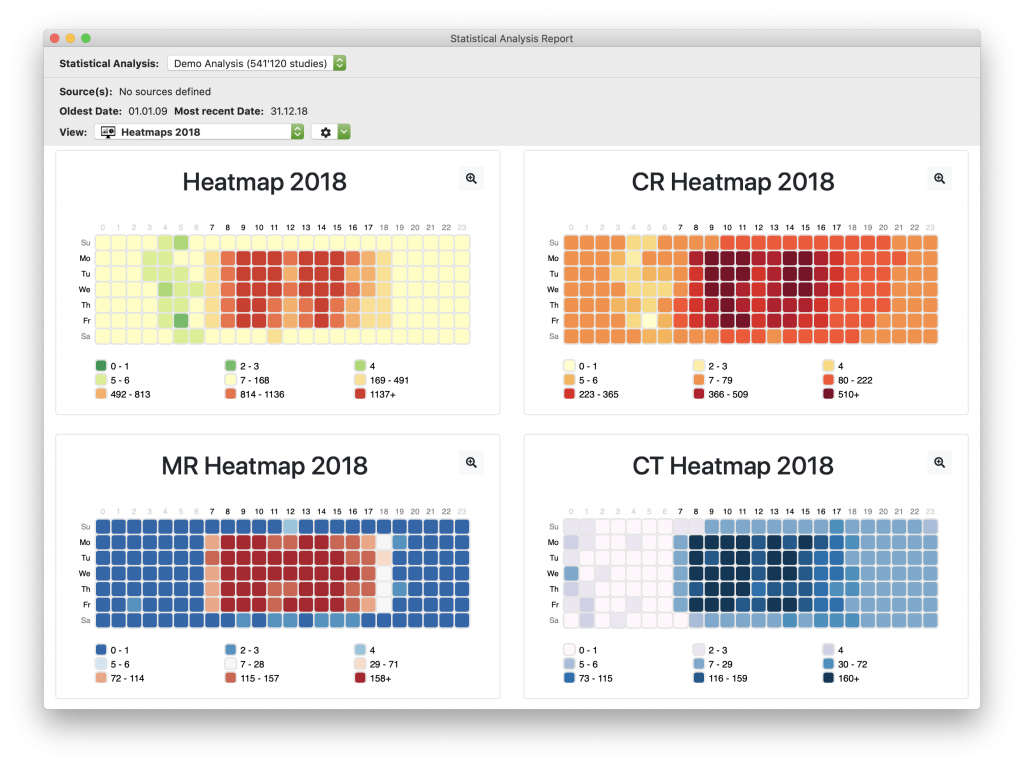
With this dashboard, you can clearly see the activities hours for conventional radiography, MR and CT exams. The period between 17:00 and 19:00 seems underutilized.
Question: Who are our most important referring doctors?
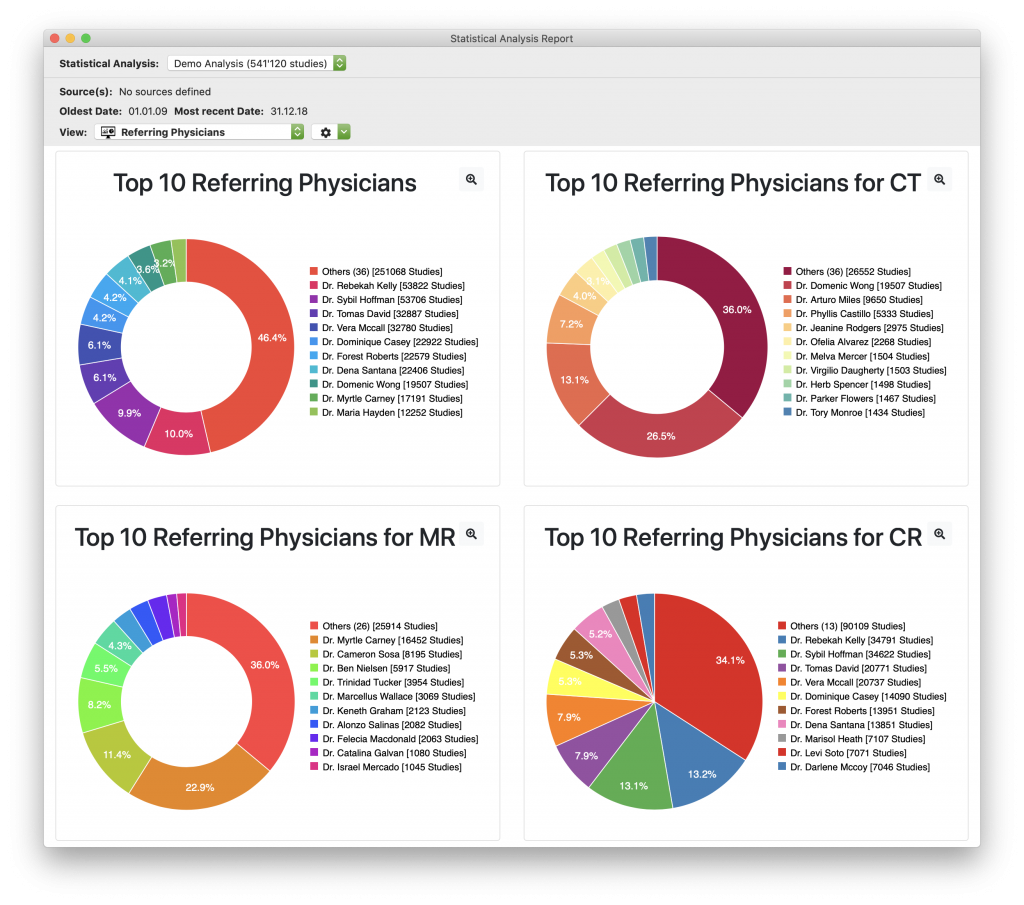
With this dashboard you can see the most important referring physicians for conventional radiography, MR and CT exams. You should probably contact personally these doctors, and ask them how you can improve your service.
Question: On-call activity is always complicated to monitor… but what is the global trend? Do I need to mobilise more personnel?
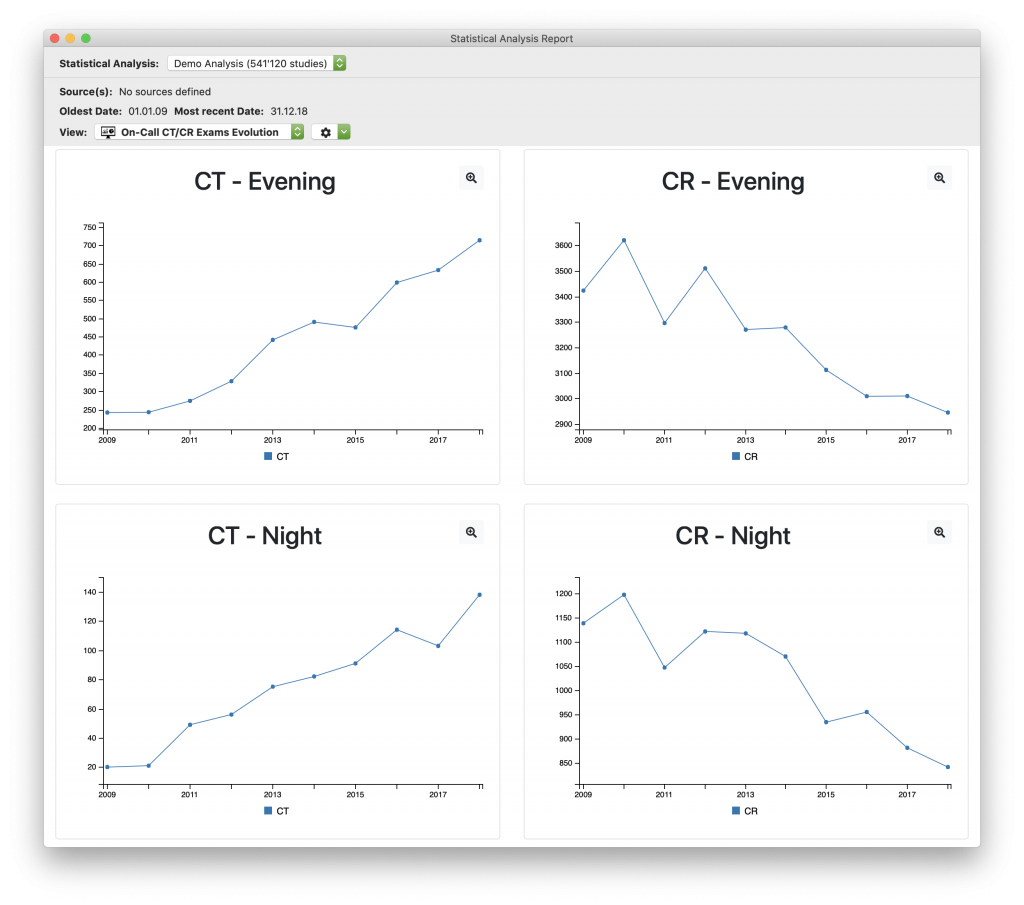
With this dashboard, you can clearly see that CT exams have increased during on-call periods. On the contrary, activity for conventional radiography images have decreased during the same period.
How to use this tool?
This tool is separated in two windows, accessible from the Network menu in OsiriX.
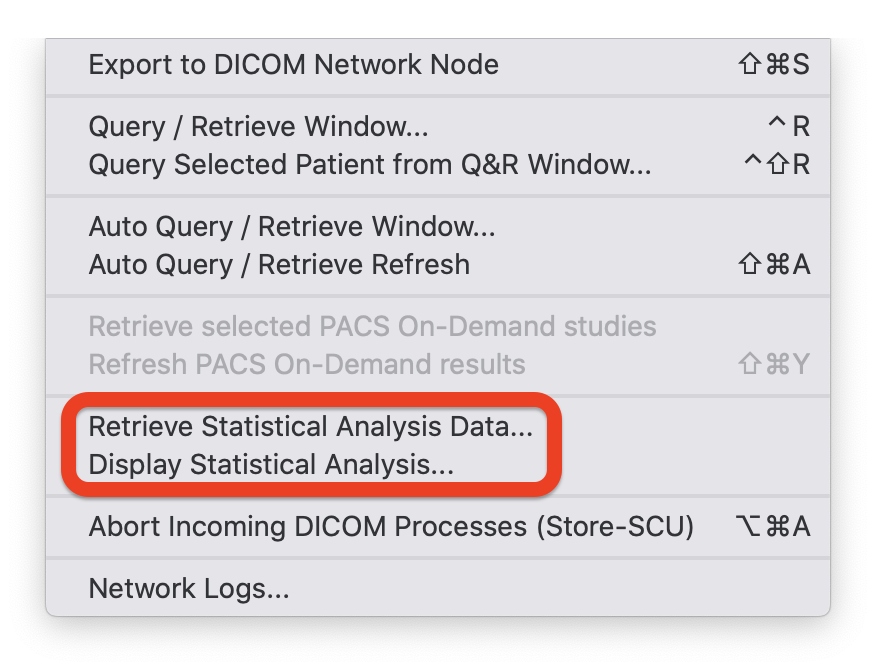
1) Retrieve Statistical Analysis Data
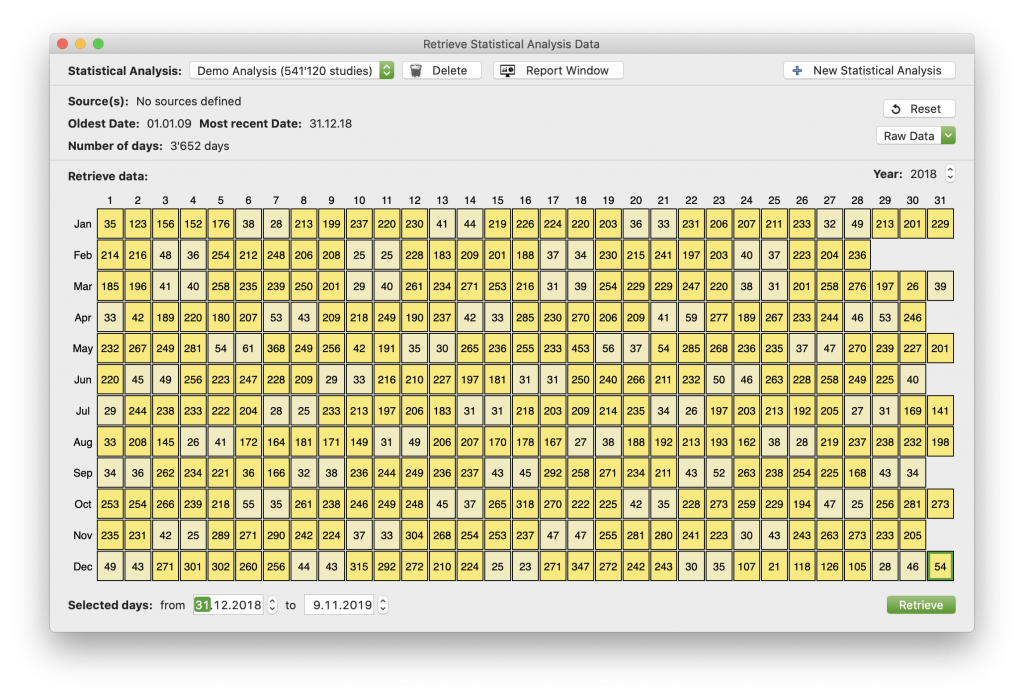
In this window, you can create a statistical analysis. A statistical analysis is a database containing the studies description for each day during the year. You can define the sources (DICOM nodes and databases) for each statistical analysis and easily retrieve the data to keep the database up-to-date. This tool is based on the DICOM standard to ensure that it can extract data from any DICOM compatible source. You can export or import the database to a CSV file to analyse it with another software.
2) Display Statistical Analysis
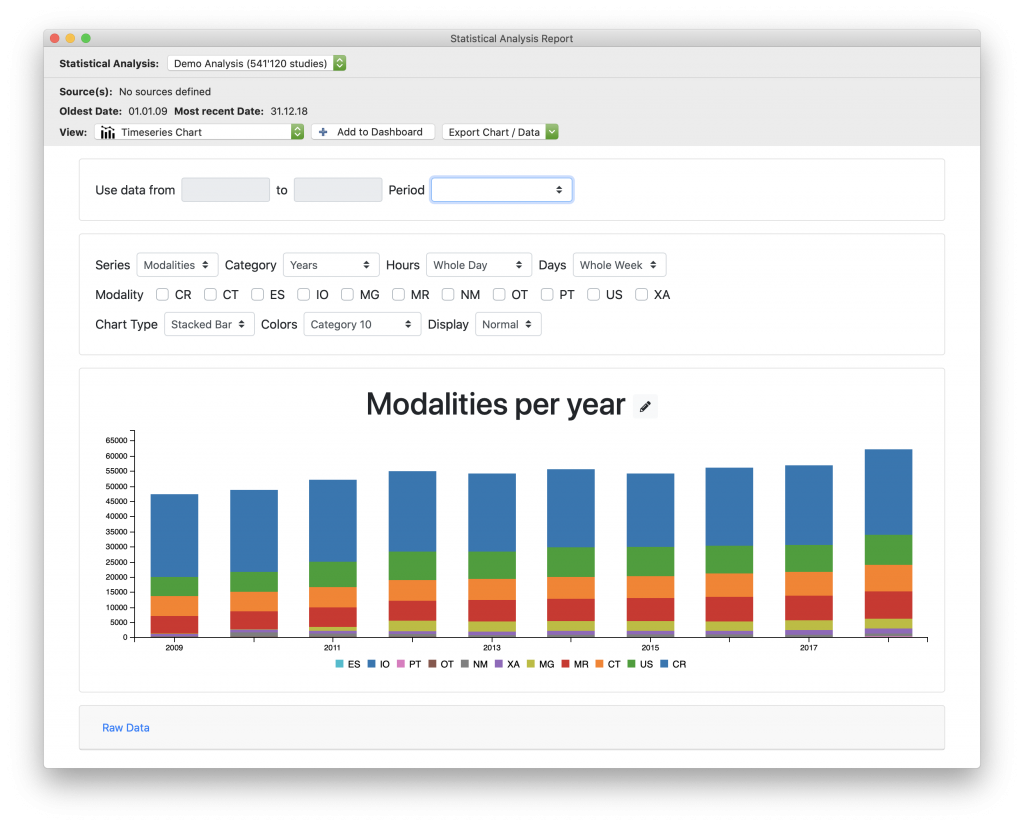
In this window, you can extract statistics and display them as charts. You can define dashboards with your own charts settings to personalise your environment. There are 4 types of charts available: Timeseries Chart, Donut Chart, Heatmap, Stacked Bar Chart. Each chart type has several parameters to configure, including modalities, time periods, and extracted field (Referring Physician, Performing Physician, Study Name, Modality, Manufacturer Model Name, Body Part Examined, Day Of Week, Month, Hour Of Day).
Start using OsiriX Statistical Analysis
Statistical Analysis is available in OsiriX MD (version 11.0.1 or higher).